| Sales & Inventory Report By Product Category |
|
|
One of the reports that you can generation upon completion of the Sales Activity and Inventory Report is a specialized report which groups the data by category.
To create this report, select PRODUCT TOOLS >> INVENTORY FUNCTIONS from the main menu. The following dialog box appears:
Depending upon your needs, you can either run a "Current Inventory" or "Choose Starting and Ending Dates."
Let the inventory run. When the process is finished, the "Sales Activity and Inventory Report Screen"' will appear. The Inventory Report Screen looks like:
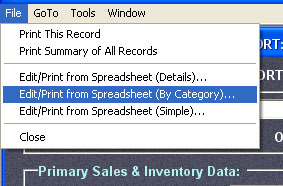
From the menu at the top Select FILE >> EDIT/PRINT FROM SPREADSHEET (BY CATEGORY):
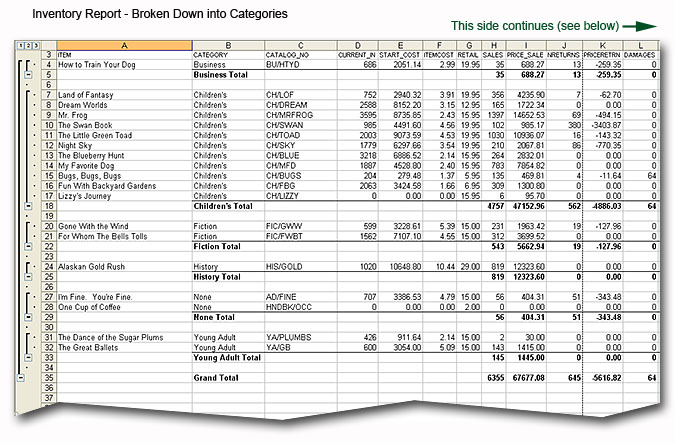
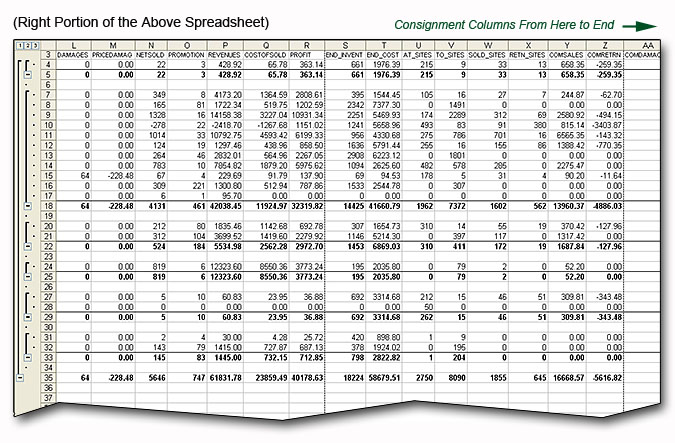
Once you make the menu choice (above), the data will be moved to Excel. You can manually manipulate the data - or if you have the Level 6 or 7 programs, you can run a macro. (For information on obtaining the macro, select HELP >> OBTAINING REPORT MACROS.) This is what the spreadsheet looks like after you run the macro:
You can see from the sample, above, that the products are grouped by category. All data for each product is included, but also included are total sales and inventory information for each category. When the report is run on a periodic basis it allows you to track the process of your product categories. For a description of each of the columns found on the report, see Inventory Report: Info on Each Report Column
|